

IRCC's H1 2026 data: permanent residence down 12.4%, Express Entry down 32.7%, and post-graduation work permits up 232%, recomputed from official files.

On 18 August 2026, Immigration, Refugees and Citizenship Canada refreshed five of its monthly open-data files at the same time. Between them they cover permanent residence admissions, Express Entry landings, study permits, work permits, and transitions from temporary to permanent status — and all five now run through 30 June 2026, giving a complete first half of the year on a single reporting window. We downloaded the source files ourselves on 19 August and recomputed every number below from the raw data rather than relying on secondary coverage. Most of what has been written about this release is broadly accurate on the headline totals. Two of the more important findings, though, sit one level below those headlines, and we have not seen them reported anywhere.
What Was Released, and What These Files Can Actually Tell You
All five datasets live on the federal open-government portal and are free for anyone to download. If you want to check any figure in this article, these are the exact sources:
- Permanent Residents — Monthly IRCC Updates: admissions by province, category, and country
- Express Entry Permanent Residents — Monthly IRCC Updates: landings under Express Entry specifically
- Study Permit Holders — Monthly IRCC Updates: permits taking effect, by citizenship and province
- TFWP and IMP Work Permit Holders — Monthly IRCC Updates: including post-graduation work permits
- Transition from Temporary Resident to Permanent Resident Status: who converted, and from which status
Two limits are worth stating before any of the numbers, because they are easy to lose once percentages start appearing. First, IRCC rounds every value in these files to the nearest 5 and suppresses counts between 0 and 5 — the department labels several of the files "not for calculations" for exactly that reason. Totals built from them are close, but they are not exact, and a percentage carried to one decimal place carries that imprecision with it. Second, these files count admissions and permits, not applications or approval rates. A month with fewer landings tells you how many people IRCC finished processing and admitted that month. It does not, on its own, tell you that refusals rose, and nothing in this data speaks to the outcome of any particular case.
Everything below describes the system as a whole. Whether any of it changes what you should do depends entirely on your own profile, status, and timing — that is a conversation, not a statistic.
Permanent Residence: Down 12.4%, but the Monthly Trend Is Recovering
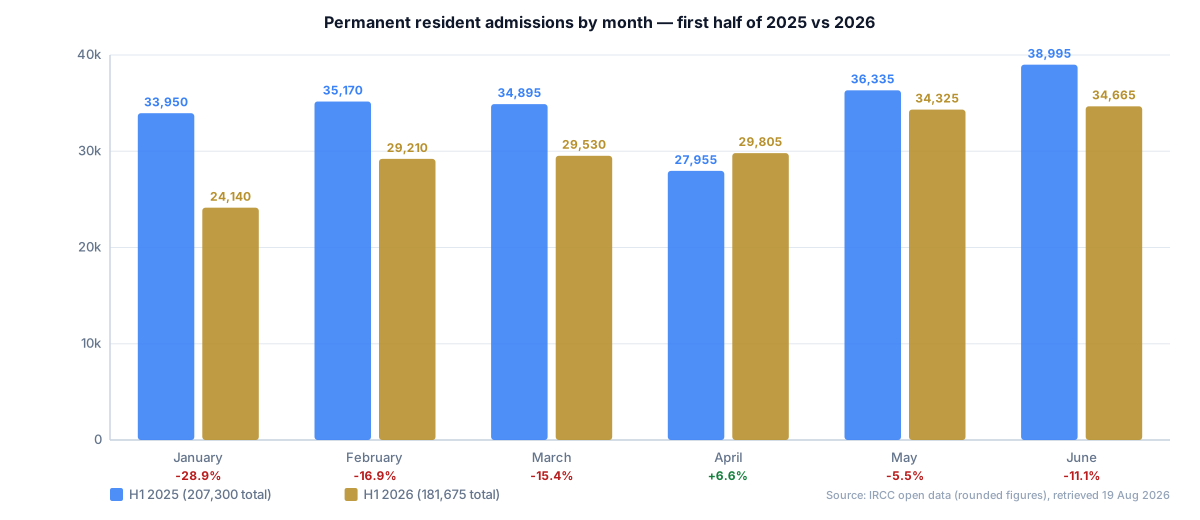
Canada admitted roughly 181,675 permanent residents between January and June 2026, against about 207,300 in the same six months of 2025 — a reduction of some 25,625 people, or 12.4%. The half-year total is the least interesting part of it. The monthly shape matters more: January came in 28.9% below January 2025, and the gap then narrowed every month except June. April was the turning point, the first month of 2026 to beat its 2025 equivalent, and May and June both landed near 34,500.
The 2026–2028 Immigration Levels Plan sets the annual permanent residence target at 380,000. Reaching it from where the first half finished would take roughly 198,000 admissions across July to December — about 33,000 a month. June ran slightly above that. That makes the target arithmetically reachable rather than out of reach, but it assumes six uninterrupted months of processing, and admissions targets are planning figures, not commitments. We would not build any personal timeline on the assumption that the annual number lands exactly where the plan says.
Where the Reduction Actually Landed
The cut was not spread evenly. Almost all of it came out of the economic class, which fell 22.8% — from about 130,470 admissions to 100,705 — while every other category held far steadier or grew.
- Economic: down 22.8%. Its share of all admissions dropped from 62.9% to 55.4%
- Sponsored family: down only 4.0%, so its share actually rose, from 22.6% to 24.8%
- Refugees and protected persons: up 35.1%, from roughly 24,295 to 32,825 — a share jump from 11.7% to 18.1%, consistent with the one-time protected-persons initiative in the Levels Plan
- Humanitarian and other: down 44.3%, the steepest proportional fall of any category, though from a small base
Provincially, Ontario absorbed the largest absolute reduction — from about 91,385 to 78,090, down 14.5% — which alone is over half the national shortfall. Quebec fell hardest in percentage terms at 23.5%, and British Columbia dropped 17.8%. Alberta was comparatively insulated at 5.6%. Three provinces actually admitted more permanent residents than a year earlier: Nova Scotia (up 7.8%), Saskatchewan (up 4.5%), and Manitoba (up 4.0%). For anyone weighing a provincial route, that divergence is more useful than the national average — the national figure describes a country, not a program you can apply to.
The Closed Business Streams Are Visibly Winding Down
One pattern in the economic detail is worth naming plainly, because it is the statistical tail of programs that no longer accept applicants. The federal Start-up Visa and Self-Employed Persons Program are closed to new applications, and the first half of 2026 shows the residual inventory being processed out:
- Start-up Business: about 1,150 admissions in H1 2025, down to roughly 110 in H1 2026 — a 90.4% fall
- Self-Employed Persons: from about 605 to 40, down 93.4%
- Investor (legacy federal category): from about 415 to 175, down 57.8%
- Temporary Resident to Permanent Resident Pathway (the 2021 one-time pathway): from about 1,130 to 405, down 64.2%
These are legacy files reaching the end of their processing queue, not live routes. If you encounter marketing that presents the Start-up Visa or the federal Self-Employed programme as something you can apply to today, this data is one way to see why that is wrong. Foreign startup and investor programmes run by other countries are unaffected by any of this, and Quebec's investor programme is legally open but sits behind requirements that very few applicants meet.
Express Entry: The Collapse Is in the Provincial Channel, Not the Federal One
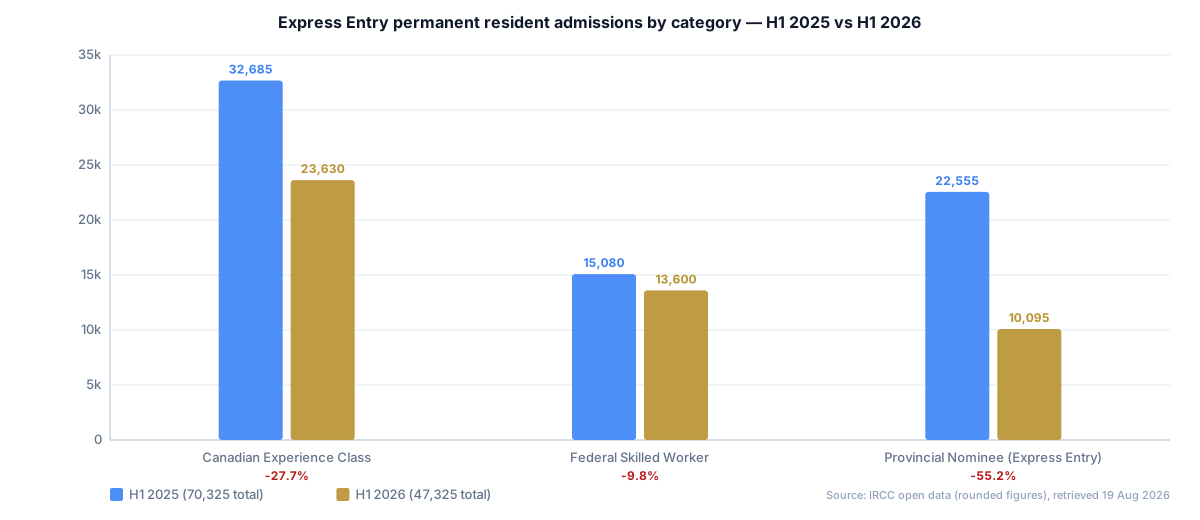
Express Entry landings fell from about 70,325 to 47,325 in the first half — down 32.7%, a steeper contraction than the permanent residence system as a whole. That much has been widely reported, usually attributed to smaller draws and higher CRS cut-offs in the Canadian Experience Class. Splitting the same file by category tells a different story:
- Provincial Nominee Program (Express Entry-linked): from roughly 22,555 to 10,095 — down 55.2%
- Canadian Experience Class: from about 32,685 to 23,630 — down 27.7%
- Federal Skilled Worker: from about 15,080 to 13,600 — down just 9.8%
The enhanced provincial channel lost more than half its volume, and it accounts for the largest single share of the Express Entry decline. What makes this more striking is the contrast with the provincial nominee category overall, which fell only 17.3% across all admissions. In other words, base provincial nomination held up considerably better than the Express Entry-aligned stream did. The Levels Plan actually raised the 2026 provincial nominee allocation to 91,500, so this is not a target reduction showing up in the data — it looks like a throughput and sequencing effect between federal and provincial processing. Practically, if your plan runs through an enhanced provincial nomination, the relevant number for you is 55.2%, not 32.7%, and that is worth knowing before you assume a nomination converts on last year's timeline.
Geographically the Express Entry decline concentrated in the same places: Ontario down 36.3%, British Columbia down 39.1%, Manitoba down 32.1%, Alberta down 22.9%.
Study Permits Rebounded Sharply in the Second Quarter
While permanent residence contracted, new study permits moved the other way. Permits taking effect in Q2 2026 rose to about 80,715 from 54,935 a year earlier — up 46.9%, with June alone up 80.6%. That reversal follows a weak first quarter, down 24.4%, so the two quarters largely cancel: the first half finished at roughly 151,720 against 148,910, a rise of only 1.9%. Anyone quoting the Q2 rebound without the Q1 fall is describing half a year.
The shift in where students come from is the more durable finding. India, still the largest single source, declined 5.2% year over year in Q2 while nearly every other major source country grew:
- China: about 5,660 to 12,700 — up 124.4%
- Ukraine: about 640 to 5,910 — up 823.4%, the largest proportional move in the release, from a very small base
- South Korea: about 930 to 2,385 — up 156.5%
- France: about 645 to 1,515 — up 134.9%
- Vietnam: about 1,375 to 2,530 — up 84.0%
- Iran: about 1,280 to 1,985 — up 55.1%
- Nigeria: about 3,950 to 5,210 — up 31.9%
For the communities we work with most closely, the Iranian and Vietnamese figures are the ones to note — both grew substantially in a quarter when the largest source country shrank. A quarter is not a trend, and none of this changes the eligibility requirements or the provincial attestation letter system that governs study permit intake. It does suggest the 2026 cap has redistributed demand across source countries rather than simply suppressing it.
Post-Graduation Work Permits Tripled — While the Exit Narrowed
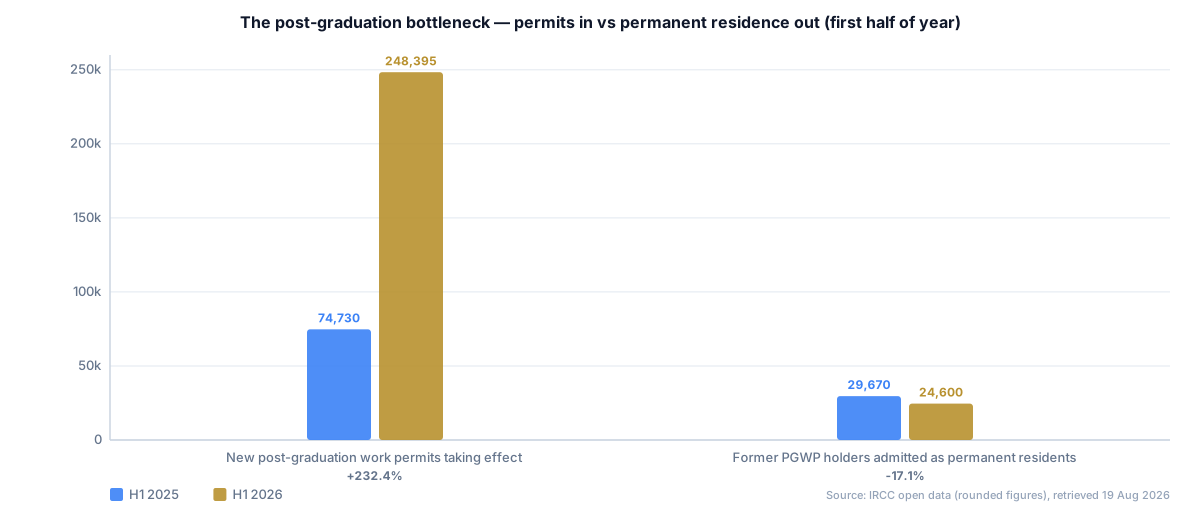
The largest movement anywhere in this release is in the International Mobility Program, where permits taking effect rose 68.7% across the first half and 105.5% in Q2 alone. Nearly all of that is one stream. Post-graduation work permits went from about 74,730 to 248,395 in the first half — up 232% — and now make up 49.4% of all International Mobility Program activity, against 25.1% a year ago. Strip post-graduation permits out and the rest of the programme grew a comparatively ordinary 13.9%. The "IMP doubled" framing is really a post-graduation story wearing a larger coat.
The cause is not new policy; it is arithmetic from old policy. Canada issued record volumes of study permits in 2022 and 2023, and students who enrolled in two- and three-year programmes are now finishing and applying for post-graduation permits. The tightening Ottawa introduced from 2024 onward — study permit caps, restricted fields of study, new language requirements — applies to cohorts that have not graduated yet. Those measures will reduce post-graduation volumes eventually, but not for another two to three graduating years.
That much has been reported. The part that has not, and the reason we pulled the transitions dataset, is what happened at the other end over the same six months. Admissions to permanent residence of people who previously held a post-graduation work permit fell 17.1%, from about 29,670 to 24,600. So in the same half-year, the number of graduates entering the temporary workforce more than tripled while the number leaving it for permanent residence declined. That is the bottleneck stated precisely, and it is a materially different claim from the comparison in circulation, which sets new permits against a narrower transition figure of about 11,305 and produces a gap that looks far more dramatic than the data supports.
It is also worth knowing that post-graduation permits sit outside the Levels Plan's 170,000 International Mobility Program target — IRCC counts them as a change of status rather than a new arrival, which is stated in the plan's own footnotes. So this surge does not breach a target; it simply is not covered by one.
What This Means If You Are Planning Right Now
None of this changes any eligibility rule, and none of it predicts a decision on an individual file. What it does change is the realism of certain assumptions:
If any of the above touches your situation, the useful next step is having someone look at your actual dates, status, and profile — not extrapolating from a national average. We review files like this every week.
- Competition among in-Canada graduates is materially higher than a year ago. A far larger cohort holds post-graduation permits while fewer are converting to permanent residence. If your plan is "graduate, work, then apply", the queue ahead of you is longer than it was.
- An enhanced provincial nomination is not converting on last year's pace. The Express Entry-linked provincial channel is down 55.2%. Base provincial nomination held up much better — which may be worth weighing if both are open to you.
- Watch permit expiry dates more carefully than usual. With a longer wait to permanent residence, maintaining valid status through that wait is doing more work in more plans than it used to. Bridging options and extension timing deserve attention early, not at the last month.
- Provincial divergence is real. Nova Scotia, Saskatchewan, and Manitoba admitted more permanent residents than a year earlier while Ontario, Quebec, and British Columbia fell. Where you intend to settle affects more than lifestyle.
- Do not plan around the closed streams. The Start-up Visa and federal Self-Employed numbers here are a queue emptying, not a door open.
How We Produced These Figures
We downloaded the five source files directly from IRCC on 19 August 2026, the day after the department updated them, and computed every total, share, and percentage in this article ourselves. Suppressed cells (counts of 0 to 5, which IRCC publishes as "--") are treated as zero, which understates totals very slightly. Because the underlying values are rounded to the nearest 5, our figures differ marginally from other published summaries of the same release — generally by a few hundred out of six-figure totals — and we have written "about" and "roughly" throughout rather than implying a precision the source data does not have. Where a figure comes from policy rather than data, it comes from the 2026–2028 Immigration Levels Plan and its supplementary tables. Immigration information changes; this article reflects the data as published on 18 August 2026 and verified on 19 August 2026, and it is general information, not legal advice about your case.
Talk to a Licensed Consultant About Your Own File
Statistics describe a system. They do not tell you whether your nomination will convert in time, whether your permit should be extended now or later, or which route fits the profile you actually have. ITC iLand is led by Ramin Asadi, a Regulated Canadian Immigration Consultant (CICC No. R407111), and we read every IRCC data release so that the advice we give reflects the system as it is currently operating rather than how it worked last year.


